BIDS GUIs: Difference between revisions
No edit summary |
|||
| Line 31: | Line 31: | ||
[[File:Meg_plotting_options.png | 700px]] |
[[File:Meg_plotting_options.png | 700px]] |
||
Plot All MEG channels (unorganized view) <br> |
Plot All MEG channels (unorganized view of All channels) <br> |
||
[[File:Plot_meg_all.png | 700px]] |
[[File:Plot_meg_all.png | 700px]] |
||
Plot Subset of meg channels representing the Left (top half) to Right (bottom half) display <br> |
|||
[[File:Plot_meg_fullview.png | 700px]] |
|||
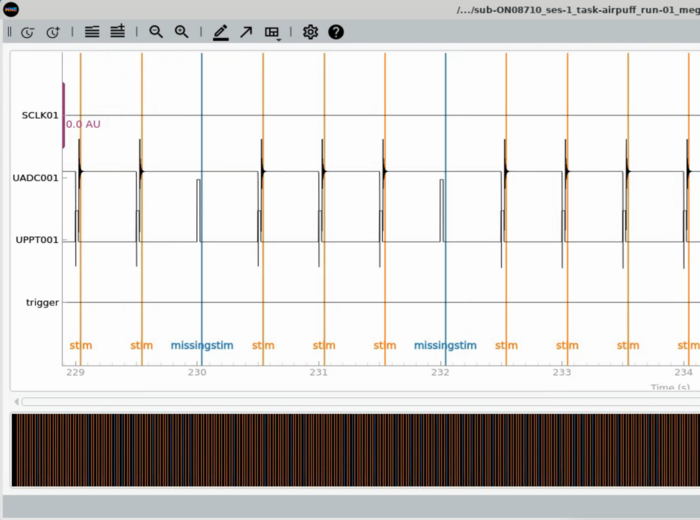
Plot Trigger Channels <br> |
Plot Trigger Channels <br> |
||
Note the auditory delay added to the triggerline pulse <br> |
|||
[[File:Plot_meg_trigview.png | 700px]] |
[[File:Plot_meg_trigview.png | 700px]] |
||
Revision as of 16:30, 3 December 2024
What is BIDS
https://bids-specification.readthedocs.io/en/stable/
BIDS is a standard specification for neuroimaging/physiology data. This currently includes at least: MRI, fMRI, DTI, EEG, MEG, fNIRS (and possibly ECOG/sEEG). BIDS typically describes how RAW data is organized - and processed data is located in the bids_dir/derivatives/{AnalysisPackage}/{SUBJECT}/... The main advantage is that common code can be generated to process data organized in a standard format. Therefore, you should be able to import the bids data into any number of neurophysiological packages (MNE, Brainstorm, SPM, Fieldtrip, ...). Additionally, standardized processing packages known as BIDS apps can be used to process the data in the same way as long as the data is organized in BIDS.
On Biowulf
Start a compute node from the terminal
sinteractive --mem=12G --cpus-per-task=4 --gres=lscratch:50 #adjust mem and cpus accordingly
module use --append /data/MEGmodules/modulefiles
module load mne/dev1.5.1
bids_qa_gui.py -bids_root <<PATH to BIDS dir>>
GUI Overview
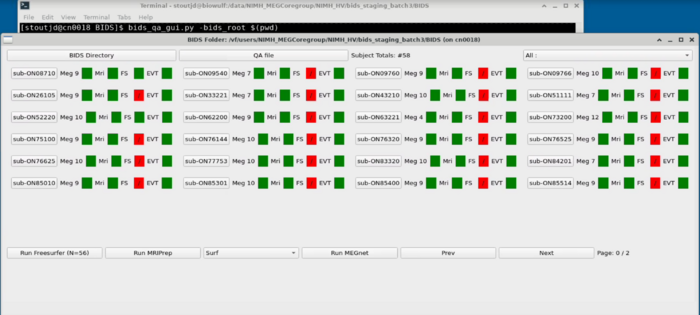
Project Panel
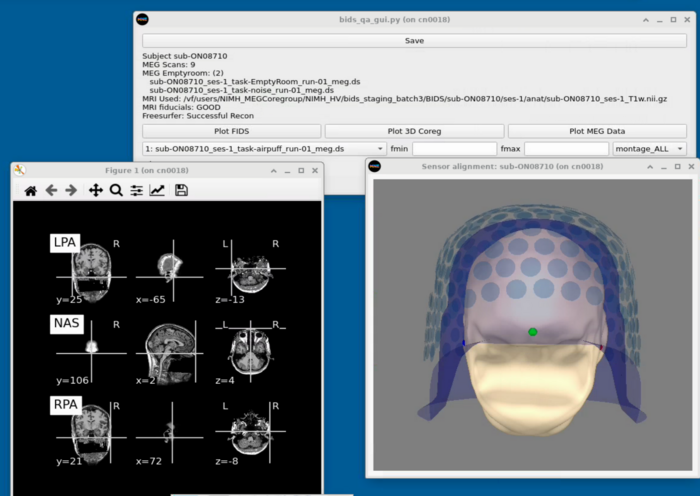
Subject Panel
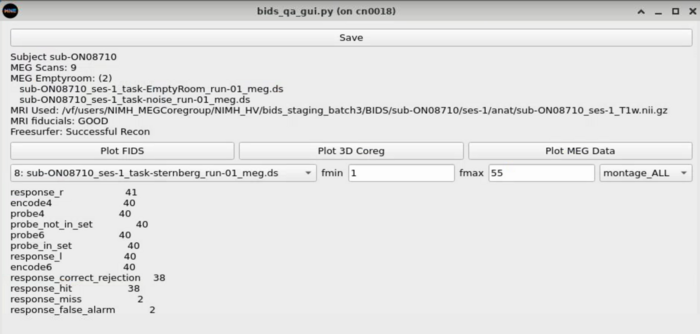
Task Switcher
Changing the task - shows the number of epochs in the selected task
MRI Viewing
MEG Plotting
Dropdown with MEG plotting options

Plot All MEG channels (unorganized view of All channels)
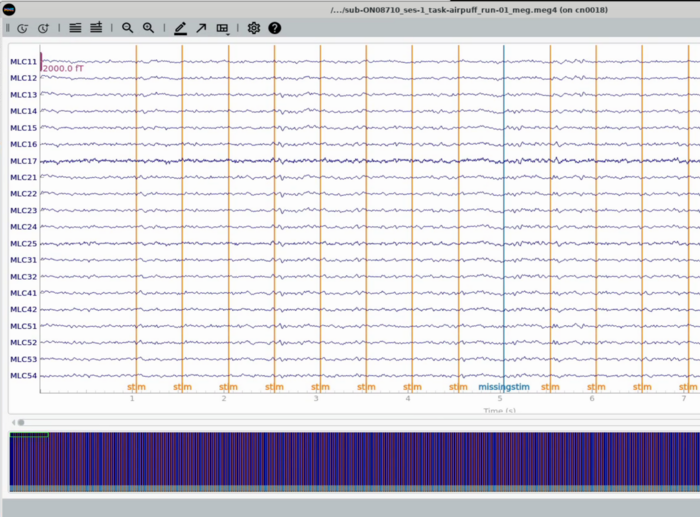
Plot Subset of meg channels representing the Left (top half) to Right (bottom half) display
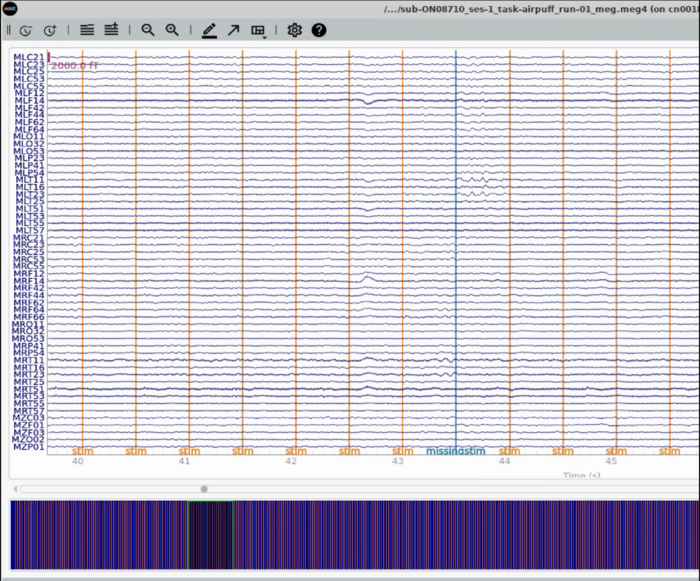
Plot Trigger Channels
Note the auditory delay added to the triggerline pulse
